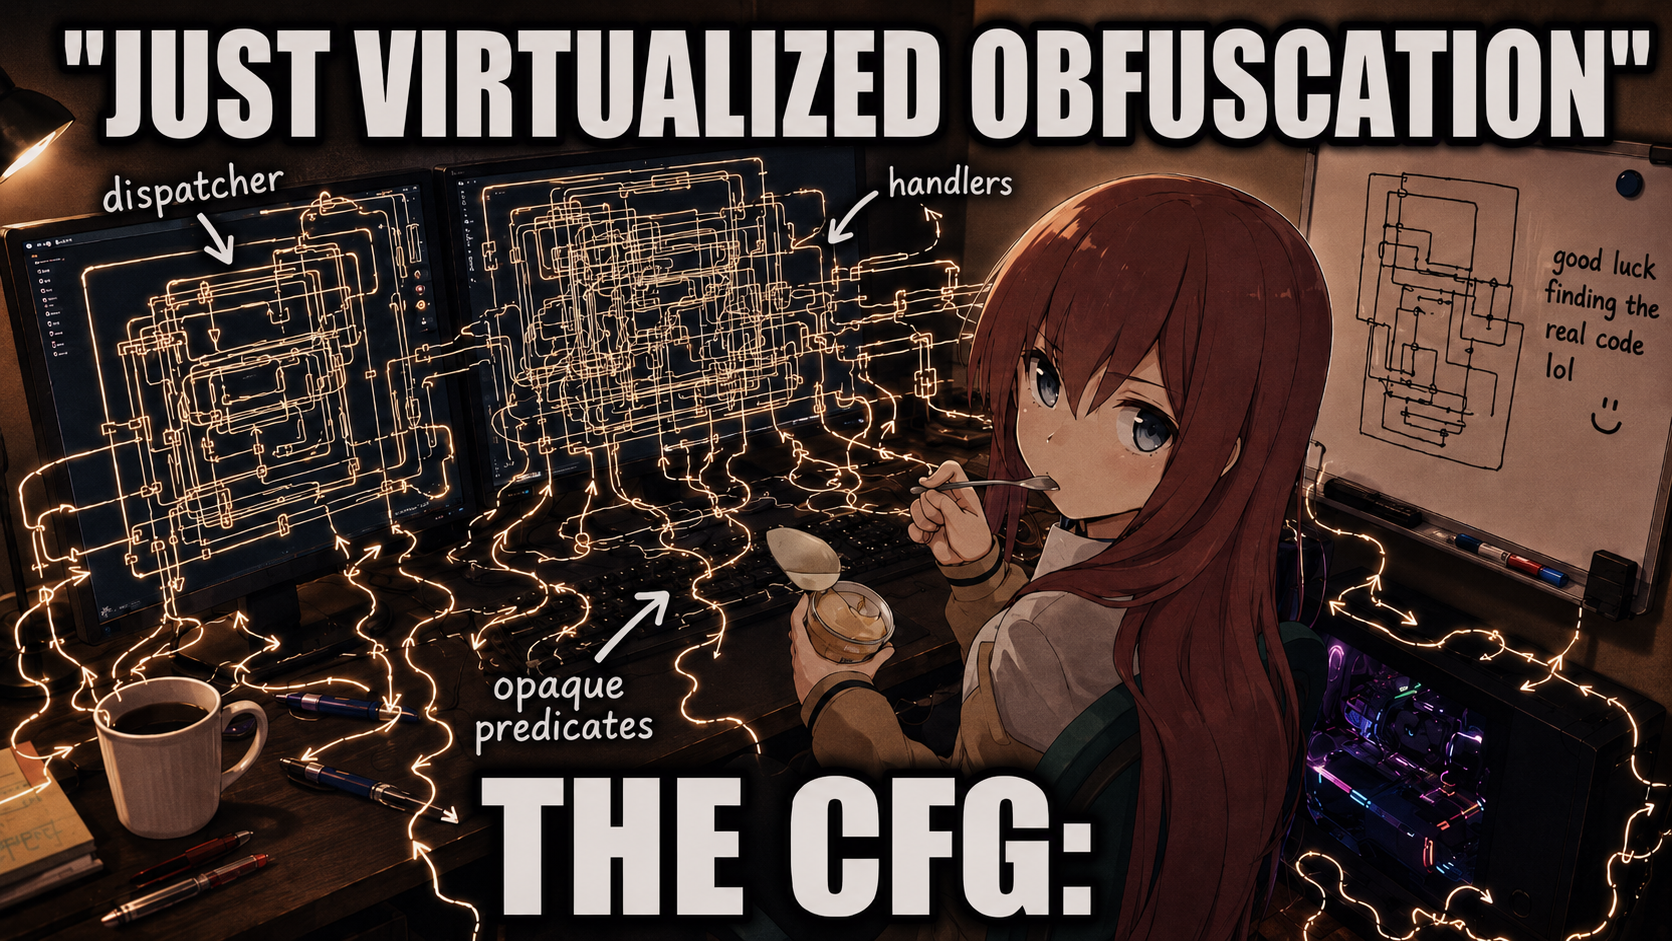
A ten-instruction check can turn into several thousand instructions after virtualization. The protected logic is still small, but now it lives behind an interpreter, a private instruction set, encrypted bytecode, fake state, and control flow designed to make the disassembler miserable.
I started collecting these notes after repeatedly finding the useful explanation halfway down an old forum thread. The material is scattered across conference slides, Chinese tutorials, academic papers, GitHub repositories, and attachments that should never touch a host machine. Some of it is dated. The good parts have aged better than the tools.
I do not trust one-click unpackers for this work. They tend to depend on one protector build and one set of handler templates. The method transfers better: identify the virtual machine state, recover handler semantics, rebuild control flow, lift the result into something an optimizer understands, then compare the recovered function against known behavior.
Scope: use these methods on software you own, samples you are authorized to inspect, crackmes, malware research, and defensive analysis. Treat old forum attachments as hostile files.
Start with the machine, not the brand
VMProtect, Themida, Code Virtualizer, and in-house protectors differ in implementation, but most expose the same working parts once the wrapper noise is removed:
- A virtual instruction pointer, often called VIP, VPC, or
VM_EIP. - A virtual stack pointer and a block of virtual registers.
- An opcode fetch and decode transform.
- A dispatcher that selects the next handler.
- A handler table, or a direct-threaded chain where handlers select each other.
- Entry and exit code that transfers state between the native CPU and the virtual machine.
The first job is to name those pieces. Do it before writing a lifter. If the VIP location is still a guess, every later abstraction is built on a guess too.
The VMProtect 1.81 beginner analysis on 52pojie is a good first lab because it walks from VM entry to bytecode and handler discovery. Follow it with the manual trace from VM entry to exit. The versions are old, but the mental model is still right: fetch an opcode, decrypt it, resolve a handler, execute the handler, update virtual state, repeat.
That loop is the first stable fact in an otherwise noisy program.¹¹ Old tutorials are useful for structure, not for current signatures. Register assignments, transforms, and handler layouts change between versions and protection profiles.
Do not begin by asking how to remove the protector. Ask what state its machine must preserve to keep executing.
Pick the right evidence
Static analysis gives addresses, tables, cross-references, and code that did not execute in your trace. It also suffers most when the protector floods the function with opaque branches and indirect dispatch.
Dynamic traces show the path the VM actually took. Repeated dispatcher code and handler scaffolding become obvious when the same native regions appear thousands of times. The cost is coverage. A clean trace of one input is still one path.
Semantic methods sit between the two. Taint analysis, symbolic execution, slicing, and IR lifting try to preserve only operations that affect the protected function's observable behavior. They can cut through interpreter noise, but memory aliasing, flags, indirect branches, loops, and external calls remain hard.
I would not choose one method for an entire project. Use static analysis to map the machine. Use tracing to collect behavior. Reach for semantic lifting after the trace format and VM state make sense. Starting with LLVM or Triton before that point tends to create a large debugging problem around a small reversing problem.
A workflow that survives a custom VM
- Begin with a tiny protected function whose source and outputs are known. Arithmetic and comparison functions are better than code with files, threads, callbacks, or system calls.
- Locate the VM entry and exit. Record which native registers and memory regions carry virtual state.
- Find the opcode fetch. Determine the opcode width, VIP update rule, and any rolling key used during decoding.
- Identify the dispatch model. A central indirect branch is common, but a direct-threaded VM may jump from one handler to the next without returning to one dispatcher.
- Trace several inputs. Keep the input, output, handler sequence, branch outcomes, and memory writes together.
- Normalize native instructions before comparing handlers. Ignore register allocation changes and obvious junk. Compare data flow and state effects.
- Write semantic summaries for a small set of handlers. Start with constant loads, virtual stack movement, arithmetic, comparisons, and branches.
- Recover one virtual basic block. Validate its result against the original function before following more branches.
- Build the control-flow graph only after the block semantics are trustworthy. Indirect virtual branches are where many promising prototypes stop being general.
- Lift into a small IR. Add LLVM, Remill, VTIL, Miasm, or another large framework only when the smaller representation has reached its limit.
This order is boring on purpose. Each step leaves evidence behind. When the recovered function is wrong, there are only a few places to look.
Trace reduction and compiler-assisted cleanup
Virtual machines inflate simple operations into long sequences of stack movement, flag updates, temporary state, and dispatch bookkeeping. A useful devirtualizer does not need to reconstruct the original machine code byte for byte. It needs a semantically equivalent function that a human can read and test.
The 52pojie article restoring VMP code through compiler optimization takes a practical route. It translates virtual instructions into C-like operations over locals and a virtual stack, then lets GCC or Clang collapse the noise. The result loses some original structure, but readability matters more than historical fidelity.
The limitation is control flow. An optimizer can simplify a recovered block, but it cannot invent the correct address-to-label relationship for an unresolved indirect virtual branch. Treat block lifting and CFG recovery as separate problems.
A General Method of Devirtualization is useful partly because the author later described the pattern-identification approach as tedious and pointed readers toward LLVM-based work. I like research threads that include this kind of correction. They show where a neat prototype stopped scaling.
The strongest follow-up is LLVM-powered deobfuscation of virtualized binaries. The pipeline uses dynamic taint analysis, splits traces at input-dependent conditions, lifts native instructions with Remill, reconstructs a CFG, and runs LLVM optimization throughout the process. The authors document the ceiling too: one explored path, pure functions without calls, and difficult loops. The full internship report has the detail missing from the shorter post.
Two related projects are worth keeping open while designing an IR: VTIL and Mergen. The Tickling VMProtect with LLVM series is another concrete look at lifting VMProtect behavior into compiler IR.
Symbolic execution and handler semantics
Titan is one of the cleaner examples of a semantic VMProtect devirtualizer. It uses Triton for emulation, symbolic execution, AST construction, and lifting. VIP and VSP become symbolic state. Handler meaning is inferred from the expression that reaches the handler's final stored value. Successor blocks are recovered from the native RIP expression, and the process repeats until the worklist is empty.
Titan's exact assumptions will not fit every VMProtect build or a private anti-cheat VM. Its architecture is still useful. It separates execution, state tracking, handler semantics, block discovery, and lifting. That makes failures easier to locate. There is also a Chinese Titan discussion that helps bridge the repository and the broader VMProtect literature.
Symbolic execution becomes expensive when every flag and memory access stays symbolic. Concretize what the protected function cannot observe. Model only the memory regions that matter. Keep external calls opaque until there is evidence that their internal behavior affects VM state. A devirtualizer gets nothing from perfectly modeling code that will be deleted later.
Older projects that still teach good ideas
VMAttack combines static bytecode analysis with dynamic traces inside IDA. It grades and clusters instructions, tracks inputs and outputs, and applies filters to remove recurring VM infrastructure. The implementation targets Python 2 and old IDA versions, so I would study the design instead of reviving the plugin. Its paper is easier to reuse than the code.
VirtualDeobfuscator follows the same broad idea: remove interpreter infrastructure while retaining the protected program's semantics. The Black Hat 2013 slides and presentation video are useful historical context.
FKVMP, VMP Analysis Plugin 1.4, VMSweeper, and Oreans UnVirtualizer belong in the same box. They contain useful ideas about handler recognition, expression simplification, bytecode debugging, and native reconstruction. Their version assumptions and runtime dependencies make them poor foundations for a new project.
XxDisasm's VMProtect analysis plugin is another historical reference for trace-based pseudocode recovery against VMProtect 3.0 to 3.2.
Papers worth keeping nearby
- A Generic Approach to Automatic Deobfuscation of Executable Code develops a dynamic taint and data-dependency approach for separating protected semantics from execution scaffolding.
- Symbolic deobfuscation: from virtualized code back to the original combines symbolic execution with compiler optimization.
- Saturn: Software Deobfuscation Framework Based on LLVM is useful when designing an LLVM-centered simplification pipeline.
- Loki: Hardening Code Obfuscation Against Automated Attacks explains how a modern VM design can frustrate automated semantic recovery. Reading the defender's design makes weak assumptions in a lifter easier to see.
- VMAttack: Deobfuscating Virtualization-Based Packed Binaries documents a mixed static and dynamic analysis pipeline.
- "Nightingale: Translating Embedded VM Code in x86 Binary Executables" is worth searching by title in an academic index.
- "Symbolic Execution of Obfuscated Code" by Yadegari and Debray, CCS 2015, studies symbolic techniques against obfuscated binaries.
- "Towards Static Analysis of Virtualization-Obfuscated Binaries" by Johannes Kinder, WCRE 2012, focuses on static reasoning over virtualized code.
- "Deobfuscation of virtualization-obfuscated software: a semantics-based approach" by Coogan et al., CCS 2011, is an early semantics-first treatment.
- "Unpacking virtualization obfuscators" by Rolf Rolles, USENIX WOOT 2009, remains part of the core reading trail.
- "Automatic Reverse Engineering of Malware Emulators" by Sharif et al., IEEE S&P 2009, covers techniques that transfer well to custom interpreter analysis.
Forum material with real lab value
The DevirtualizeMe Themida 2.4.6.0 thread is better than a folder of unpacked samples because participants discuss how their devirtualizers work. One implementation used Python, Yasm, udis86, pefile, WinAppDbg, and IDAPython behind a generic virtual-address interface. Another rebuilt the CFG, removed fake branches and opaque predicates, eliminated dead code, folded constants, and used Capstone with Unicorn for short fragments.
The thread also shows why protector labels are not enough. Related VM families can share an engine while changing handler granularity and protection templates. Pattern matching may solve a challenge build and fail on the next profile.
The ExeTools discussion VMProtect Source Code Potentially Leaked contains a useful correction: protector source explains how virtualization is produced, not how to recover the original program. Handler lifting, CFG recovery, path coverage, and simplification remain separate engineering tasks.
The Reverse Engineering Stack Exchange answer on detecting virtualized code from assembly is a compact reminder that a central dispatcher is common, not mandatory. Direct-threaded VMs may dispatch from handler to handler. When static structure is ugly, a dynamic trace often reveals the fetch and decode region through execution frequency.
The discussion of VMProtect anti-debugging without WinAPI matters for tracer design. Correct API return values are not enough if timing, exceptions, or CPU behavior are unrealistic. RDTSC around expensive or VM-exit-causing instructions can expose an emulator that otherwise looks correct.
Conference material and Chinese references
The awesome-vmp bibliography is the best single index I found for Chinese and conference material. Start with the index instead of searching attachment mirrors.
- KCon 2016: VMProtect's strange journey.
- SecurityDay 2015: Inside VMProtect.
- CSAW 2016: How Triton can help reverse VM-based protections.
- China Software Security Summit 2009: VMProtect reverse analysis and static restoration.
- CARO 2008: Dealing with Virtualization Packers.
The FinSpy VM tutorial is still one of the better demonstrations of an analyst reasoning through an unfamiliar VM. Read part one on x86 deobfuscation, part two on VM analysis and bytecode disassembly, then part three on devirtualization. Chinese translations are indexed in awesome-vmp.
The practical tool stack
For static work, IDA Pro with modern IDAPython is the shortest path if it is already available. Ghidra is useful as a second opinion, especially when one decompiler turns dispatcher arithmetic into misleading pseudocode.
For tracing, x64dbg and WinDbg cover ordinary user-mode and Windows internals work. Intel PT or a dynamic binary instrumentation framework becomes useful when software breakpoints perturb timing or when the trace volume becomes unmanageable.
Capstone and Unicorn are good small tools for instruction decoding and controlled emulation. Triton is the next step when expressions, taint, and path constraints matter. LLVM with Remill, VTIL, and Miasm are options for a larger IR pipeline.
For PE access, pefile is enough for experiments. A small native parser may be worth writing later if startup time, packaging, or malformed-file behavior matters. Do not start there.
Keep the target in a snapshot-based Windows VM. Protect tiny functions with known source. Save hashes, tool versions, protector settings, trace inputs, and expected outputs. Without that record, a successful devirtualization run is difficult to reproduce and almost impossible to debug.
Where public tools tend to fail
Public devirtualizers often encode more protector-specific knowledge than their README admits. Handler signatures may depend on a single version, architecture, mutation profile, or compiler. A tool can produce plausible pseudocode while silently dropping flags, aliases, or an indirect successor.
The vmpUnPack VMProtect 3.8.7 thread contains disputed claims and unclear dependency provenance. Treat its output as a lead, not evidence. The VMProtect 3.8.1 Ultra challenge may provide a useful sample, but the posted results contain little reproducible method.
Old forum binaries need an isolated VM. Hash them before use. Do not run them on the host, and do not assume an attachment is safe because the thread is old or the account is respected.
The hard failures are less glamorous than broken opcode tables: incomplete path coverage, state that changes between VM entries, timing-sensitive behavior, self-modifying handlers, native calls, and incorrect CPU exception semantics. These are exactly the details a custom anti-cheat protector is likely to lean on.
A notes template that remains useful later
Sample/hash:
Protector/version/architecture:
Known original behavior:

VM entry and exit:
VIP/VPC register or memory location:
VSP/virtual stack:
Virtual-register/context base:
Opcode width and decrypt transform:
Dispatcher model: central / direct-threaded / mixed
Handler table and handler count:
Handler semantic signatures:
Native-call/external-instruction handling:
State persistence across VM re-entry:

Trace inputs and coverage:
Recovered basic blocks and branches:
Chosen IR:
Simplification passes:
Unresolved flags/memory aliases:
Validation cases:
Confidence and evidence:The last line matters. Record why a handler means add, not only that you named it add. Evidence might be a symbolic expression, controlled inputs, matching flag behavior, or agreement between a trace and a static slice.
A small project that can finish
- Reproduce the VMProtect 1.81 beginner analysis by hand.
- Write a small IDAPython script that labels the dispatcher, handler table, VIP, VSP, and handler entries.
- Trace one protected pure function and separate recurring VM infrastructure from input-dependent operations.
- Lift five to ten common handlers into a tiny IR.
- Recover one basic block and test it against known inputs.
- Add conditional and indirect virtual branches.
- Evaluate Triton, LLVM with Remill, or VTIL only after the small pipeline works.
That project will not defeat every commercial protector. It will produce something more useful: a devirtualization pipeline whose assumptions are visible. When it fails on an in-house VM, you can change one layer instead of replacing the whole tool.
My own stopping point is simple. If I cannot explain where the VIP lives, why a handler has the name I gave it, and how a recovered branch was validated, I do not have a devirtualizer yet. I have a persuasive trace viewer.
Once interpreter mechanics and protected semantics are recorded separately, the remaining cleanup looks much more like ordinary compiler work. Before that separation is correct, a larger IR only gives the noise better names